Positioned on the Pacific Ring of Fire, Indonesia sits atop abundant geothermal energy. The country has been developing this renewable resource for more than 40 years and now generates the world’s second-largest amount from this source. The 2.1 gigawatts of power is enough energy to power more than two million homes.
Indonesia’s geothermal potential is calculated at 29 gigawatts, which amounts to 40 percent of the total global capacity. Given this abundance and a target of producing 23 percent of its energy from renewable sources by 2025, the Indonesian government is accelerating development.
As a key player in this effort, Pertamina Geothermal Energy (PGE), a state-owned subsidiary of the oil and gas development company, is working to double production over the next five years. PGE has been in operation for 35 years and is currently running eight geothermal power plants that generate 642 megawatts of electricity.
“We want to develop new areas and add new plants,” said Ardilla Johan Erdiansyah, a reliability engineer at PGE. “We also want to monitor operations and evaluate what we have right now.”
To reach PGE’s growth goals, Erdiansyah and his colleagues are using geographic information system (GIS) technology for geothermal exploration and development and to ensure efficiency for company operations.
Power generation and geography
Volcanic and nonvolcanic geothermal energy is present on each of the five major islands in the Indonesian archipelago and on many more of the country’s 17,508 islands. PGE uses GIS-based maps and apps to assess and record the viability of each potential site, collecting field observations and readings from testing equipment.
Maps guide the exploration team to locations with faults, volcanoes, and hot springs. Across each potential site, the team records geophysical and geochemical data that it registers to the map. The future development team uses these readings to determine the best locations to drill new geothermal wells and install distribution networks.
“The operational cost of a geothermal power plant is very small compared with drilling and infrastructure costs,” said Wanda Kurniawan, operation engineer at PGE.
With the heavy risks up front in the exploration and development phase, it pays to monitor and analyze the potential of each site to get the maps right.
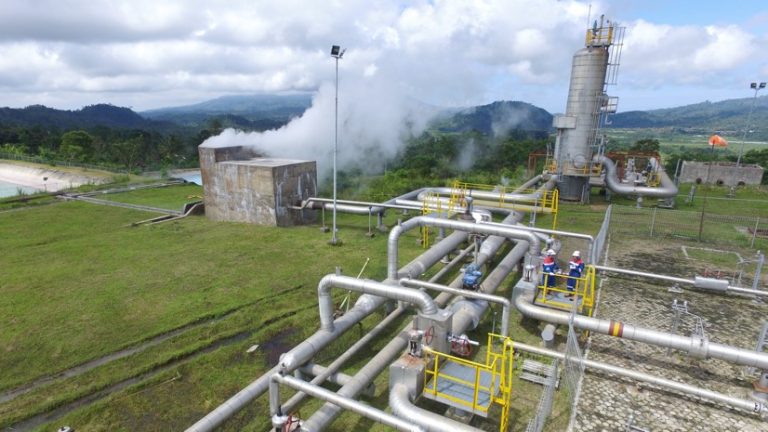
Wells are drilled several miles into the ground to pump up hot water under high pressure. When the water gets close to the surface, pressure is reduced, producing steam that spins turbines to generate electricity. The steam is then sent to a cooling tower before returning underground as water to begin the process again.
Geothermal energy has many advantages including no need to burn fuel, reliable availability around the clock, and a low carbon footprint. However, some sites cool over time.
“Recently, productivity decreased at one of our geothermal plants,” Erdiansyah said. “It took us some time to analyze the root cause of the problem because we only had numerical data. We eventually found the error and shut down the plant for maintenance. With more comprehensive location data and visualisation, we can monitor the trendline of productivity to find problems more quickly and be more efficient.”
Measuring and monitoring
Operators are relying on GIS to monitor the plants and surrounding conditions. Power generation site risks include landslides due to rainy seasons and unstable soils, and exposure to hydrogen sulfide (H2S)—a poisonous, corrosive, and flammable gas byproduct of the pumping process. By combining geospatial data with weather data, operators can determine landslide potential and provide early danger warnings. By mapping all H2S readings, they can show workers which areas to avoid.
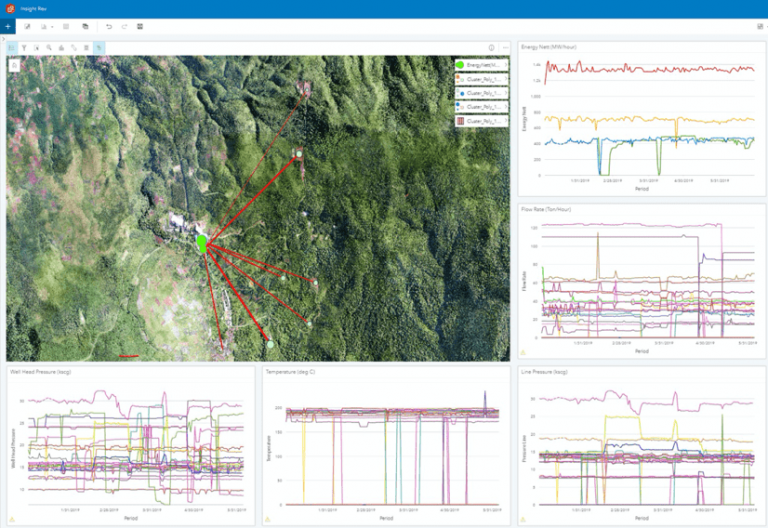
“We produce so much data every day from the subsurface to the surface,” Kurniawan said. “We record the data about wellhead pressure, line pressure, well temperature, and the flow rate of the steam produced by the geothermal wells. Seeing our operations data geospatially allows us to see the evolution of our steam field over time.”
PGE recently completed a pilot test to query and display performance metrics at one power plant using the analytics workbench within ArcGIS Insights.
The capabilities achieved through GIS can improve awareness, reduce risk, and increase efficiency, supporting PGE and the nation in its goal to significantly increase geothermal energy production.
“Combining operations data and geospatial data allowed us to see what we hadn’t seen before,” Kurniawan said. “We can see wellhead pressure over time and query spatial aspects to expand our horizons to evaluate our projects more completely.”
This article is written by Brett Dixon and first appeared on the Esri Blog.